


PROBLEM STATEMENT
Manufacturing data was scattered, visibility was limited, and decision-making was reactive. A unified, scalable platform was needed to bring real-time insight, trust, and foresight to global pharmaceutical operations.
Role
UI/UX Designer, Product Strategy
Time
~18 months
Team
20 people
Industry
LifeScience, B2B
Quick Summary
⭐️Context
Predictive Insights Center (PIC) is a data intelligence platform designed for Takeda Pharmaceuticals to bring foresight and clarity to global drug manufacturing. The existing ecosystem was fragmented, with siloed teams and limited visibility slowing down critical decision-making. PIC aimed to unify operations, streamline workflows, and enable teams to anticipate challenges before they occurred.
✅SOLUTION
The platform was built from the ground up as a scalable enterprise system with live batch traceability, predictive analytics, and role-based dashboards tailored for QA, production, and leadership teams. Supported by a robust design system and data governance model, PIC delivered a consistent, trustworthy interface that connected 30+ manufacturing sites and empowered teams to act proactively.
🎯RESULT
PIC transformed reactive monitoring into proactive insight. Process visibility improved by 55%, user adoption grew by 32%, and lead time dropped by 11%. Beyond metrics, the platform fostered a shared sense of clarity and confidence across global teams — setting a new benchmark for digital transformation in pharmaceutical manufacturing.
Context
Pharmaceutical manufacturing is deeply data-driven — but also fragmented. Teams across QA, logistics, and manufacturing used disconnected systems, delaying insights and creating risk. PIC was born to unify it all into one connected platform that could trace, predict, and prevent — before things go wrong.
Over 18 months, I helped turn that idea into a global platform that now connects 30+ sites, improves lead time and reliability, and enables proactive, data-driven decisions across manufacturing and supply.
My role
🎨
UX & Product Design
Led research, design, prototyping, and Information Architecture
🤝
Collaboration
Worked with cross-functional teams
📊
Research
Heuristic evaluation, CMI testing, user insights.
My Responsibilities
As the UX Designer + Product Strategist, I led the design from the ground up — shaping both the product direction and the end-to-end user experience.
My contributions included:
Conducted research across global teams and user roles
Designing the end-to-end UX/UI and data visualizations
Facilitated cross-team collaboration between design, data, and dev
Defined personas, workflows, and product architecture
Created the scalable design system and governance model
Ensured design decisions aligned with business outcomes
100+
Screens designed
12+
User flow defined
1
Unified Design System
Context & Challenge
Pharma manufacturing involves thousands of variables — batches, tests, shipments, and compliance checks — each handled by different teams and tools.
The organization wanted to unify everything under a single, scalable platform capable of:
Real-time batch traceability
Role-based dashboards
Predictive analytics and anomaly detection
Problem summary:
Fragmented data systems
Low visibility across supply chain
Inconsistent experience for each role
Delayed investigations and rework
The goal: create a unified digital platform that allows teams to monitor live batches, predict issues, and make informed decisions in real-time.
Discovery
We began with deep research to understand how people across manufacturing, QA, logistics, and planning were actually working — and where friction lived.
What we did
Field observations and shadowing sessions
50+ interviews across regions
Data audits of existing traceability tools
What we learned
User Quote
“I have to open three different systems just to confirm if a batch passed testing.” — QA user
Every role (QA, operator, planner) needed different data depth.
The biggest gap wasn’t data visibility, it was data clarity and confidence.
People didn’t trust their data, even when it was “available.”
Discovery Process

Miro Board Journey & Notes
We used notes made by PO and combined them with the ones that we made to make sure out data and flows was understood thoroughly.

User Workshop Miro Board
A detailed and in-depth miro board that showcases the details of the initial interactions and workshop conducted with the users.

User Activity Identifying Frustrations
In the workshop that was conducted, the users were asked to jot down their frustrations in the current system.
Framing the Problem
We reframed our core question:
How might we empower every stakeholder — from operator to executive — to trust, trace, and act on live manufacturing data with confidence?
Strategic Goals
Build one system of truth across operations.
Create role-specific experiences instead of a one-size-fits-all dashboard.
Enable predictive insights to shift from reactive to proactive.
Establish design governance for global scalability.
Product Planning
We split the platform journey into four iterative releases — each tackling complexity in layers.
Phase
Focus
Users
1
Live Batch Traceability (MVP)
Operators & QA
2
Inter-site Logistic & Planning
Planners
3
Predictive Analytics & Forecasting
Analytics & Leadership
4
Customisation
All roles
This ensured we could ship measurable outcomes early while designing for long-term scalability.
User Persona
From 50+ interviews across global sites, we identified key user groups. Each had distinct goals, data needs, and interaction patterns — making role-based experiences critical to our design strategy.
These personas shaped information architecture, dashboard structure, and feature prioritization.
Instead of building a “one-size-fits-all” interface, we designed role-based experiences, ensuring each user group saw the right data, at the right time, in the right way.
Information Architecture
Built a modular IA that scales with user roles. Tested labels and grouping with card sorting exercises.
Outcome: Clear, role-optimized navigation across 10+ user types.

Workflows
I mapped end-to-end flows for:
Monitoring live shipments
Investigating a failed batch
Comparing site performance
This helped identify unnecessary clicks, unclear hand-offs, and opportunities to automate manual steps.
Wireframing
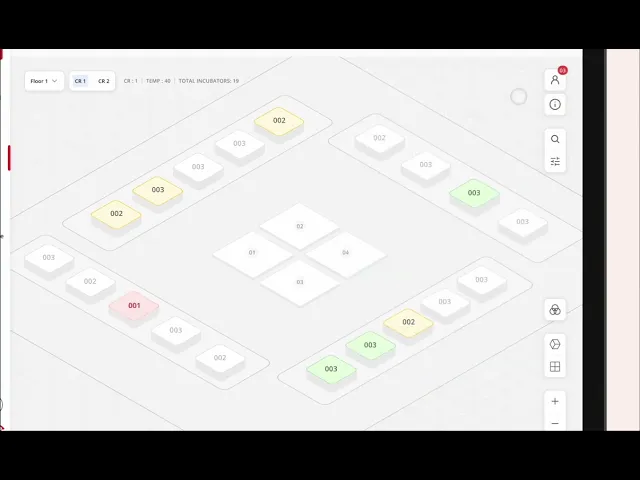
Visual Design
Once the flows were validated, I moved into high-fidelity design focused on clarity and usability.
Focused on “clarity over decoration,” modular dashboards, trace lineage view.
Design System
To make the product scalable and consistent, I built the PIC Design System from scratch.
Included
Tokenized color system and spacing scales
Reusable tables, modals, cards, graphs
Accessibility standards baked in
Documentation for designers and engineers
This design system later became the foundation for multiple enterprise products across the organization.
Testing & Validation
We conducted multiple validation rounds with real users throughout different project phases to ensure that the experience was both usable and impactful in the real manufacturing environment.
Usability Tests with QA Teams
Simulated real Quality assurance workflows.
Found key friction points and simplified complex flows.
Adjusted technical terms for better clarity.
Prototype Navigation Tests with Operators
Tested low & high-fidelity prototypes on the floor
Merged scattered data views into a single dashboard.
Refined color, hierarchy,& iconography
Feedback Sessions Post-Deployment
Collected live feedback from 30+ site users
Refined predictive alerts and visual priorities
Continuous updates based on behavior data
Impact of Testing
11%
decrease in lead time
55%
increase in process visibility
32%
growth in user adoption
6%
decrease in human error
Solution
Predictive Insight Center (PIC) brought together traceability, performance, and predictive analytics in one intuitive platform.
Core Capabilities
Live Batch Traceability: Every batch’s journey visualized in real time.
Role-Based Dashboards: Custom views for operators, QA, and leadership.
Exception Alerts: Automated prioritization for high-risk batches.
Predictive Recommendations: Early warnings to prevent failures.
Scalable Design System: Unified experience across 30+ sites.
Recognition
Deloitte Outstanding Market Contribution Award
for project impact and innovation
Outstanding Performance Award
for leadership in UX and design strategy
Outcomes & Learnings
1
Design systems are business multipliers
Investing in consistency early enabled exponential scalability later
2
Data-dense doesn’t mean confusing
Clarity, hierarchy, and visual rhythm can turn complexity into confidence
3
Deep collaboration drives enterprise success
Working closely with devs, analysts, and QA helped ensure adoption and technical feasibility
4
Proactive design starts with empathy
Understanding users’ daily frustrations turned into solutions that truly saved time and reduced risk
Reflection
This project changed how I view enterprise design.
It taught me that great UX in data products isn’t about making dashboards look pretty — it’s about giving people trust and foresight in moments that matter.
From a blank page to a globally scaled product, PIC was proof that when design meets empathy and strategy, it can truly reshape how an entire industry operates.

Detailed Figma prototypes and interaction flows are available upon request.
Request Access
When insight is clear, decisions move confidently forward.
Predictive Insights Center — Takeda

To view the case study, please open this portfolio on desktop
Predictive Insights Center — Takeda
To view the case study, please open this portfolio on desktop